Smart Data Visualization Tells a Story to Support Business Decisions!
The Wharton School of Management reports that, ‘only half of an audience is convinced by a purely verbal presentation, but that number jumps to over two thirds when visuals are added.’ Why is that? The answer is simple. Our brains grasp and respond to images, colors and patterns and more quickly assimilate information. Presenting data with colors and shapes can help the audience to understand data by telling a story. Consider how difficult it is to dig into a spreadsheet with mountains of data versus viewing a simple picture that illustrates trends and numbers in a way that is easy to understand. That’s where data visualization comes in!
Data Visualization is comprised of a graphical representation of data. Using charts, maps and graphs, a user can visualize data results in a way that is easy to understand to spot trends, patterns, and outliers. It is an excellent way to present data to non-technical staff for discussion and decision-making. Data visualization can help your business analyze data and make decisions to improve operations and strategic initiatives.
- Identify issues and challenges and clearly see the cause of these issues.
- Explore customer buying behavior to improve product placement, pricing, and competitive positioning.
- Predict sales, product maintenance needs, supply chain issues, etc.
When you consider an Augmented Analytics solution and Data Visualization tools, look for Smart Data Visualization. These tools take data visualization one step further, allowing business users to analyze, share and present information without technical skills or knowledge, and without waiting for assistance from visualization experts or programmers. With augmented data discovery and smart data visualization tools, business users can cut through that mountain of data to find those elusive nuggets of information that have the most impact on business results.
‘Smart Data Visualization combines cutting-edge technology and machine learning, with an intuitive user experience, so business users can easily leverage sophisticated tools with guidance on how to personalize data displays to create meaningful views and collaboration.’
If your business is struggling to make fact-based decisions, and to cascade analytics to team members and business users, adding Smart Data Visualization to the mix will definitely help.
Not only does smart data visualization help your team to understand the results of data analytics without the help of data scientists and IT staff, but it can be used by those same team members to present data and gain approval and acceptance by management and other team members. That’s because data displayed in this way is easy to comprehend and digest.
Users can interact easily with data discovery tools and analytics software and build a view that will tell a story using guided visualization and recommended data presentation so there is no need for assistance or delays. Guided recommendations are made based on data type, volume, dimensions, patterns and nature of data.
By combining cutting-edge technology and machine learning on the backend, with an intuitive user experience on the front end, business users can easily leverage sophisticated tools with suggestions and recommendations on how to personalize data displays to create meaningful views and collaboration.
Machine learning provides guidance to determine the visualization technique that will be the best fit for the data business users want to analyze, based on data type, data volume, data dimensions and patterns and the nature of the data. This process allows for better understanding of data, and identifies unusual patterns in data, and achieves the best output and results.
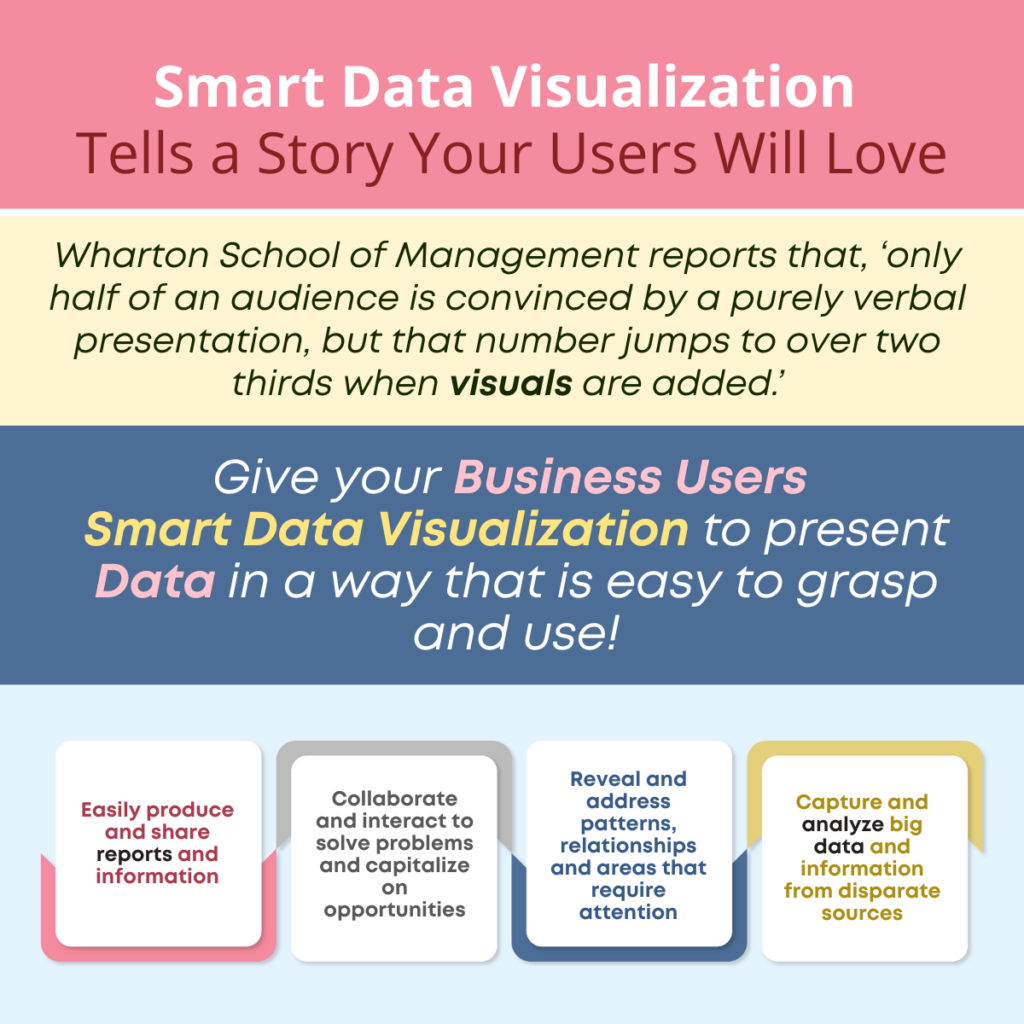
The Smart Data Visualization approach allows business users to:
- Easily produce and share reports and information
- Collaborate and interact to solve problems and capitalize on opportunities
- Reveal and address patterns, relationships and areas that require attention
- Capture and analyze big data and information from disparate sources
‘Smart data visualization helps your team to understand the results of data analytics without the help of data scientists and IT staff.’
Let Smarten help you achieve your analytics goals, democratize data, improve data literacy with Smart Data Visualization. Improve collaboration, decision-making and results with clear, intuitive reporting and data presentation.


